The Data Does Not Exist to Support "Romance is a Billion Dollar Industry"
And, more importantly, we don't need it
As we find ourselves entering the season of the romance novel trend piece, I ask that we all collectively pause before repeating bad romance data in our discourse.
Sorry, the data we’re looking for really doesn’t exist — definitely not in 2024, and we should also scrutinize the credibility of RWA’s reports, which haven’t even been updated since 2013.
The following are commonly-heard “data” points backing up the dominance of romance novels (at least commercially): do a google search and see how often these statements pop up. Their veracity ranges from “total bullshit” to “ehhh that conclusion is not supported by the data.”
“25% of all book sales are romance.” / “One third of all book sales are romance.” / “Half of all book sales are romance.”
At best, numbers like these could be describing the proportion of romance sold in mass market paperback fiction. There are various sources for these numbers: they’re all 10+ years old, and even the ones that are credible are only describing a much smaller segment of the overall traditional publishing market, not romance within the total publishing market.
“Romance is a $1.4 billion industry in the U.S.”
This “data” point dates back to a 2012 RWA report and is at best outdated, and in my opinion, also not accurate.
“Romance’s profitability supports the entire publishing industry.”
This is likely a bad conclusion drawn from already bad data. But, even if the retail sales of romance are high (that questionable $1.4 billion), show me a source that indicates the net profits for publishers are greater for romance than other genres in their portfolio. This statement has no grounding in any published data.
I’m not even going to dwell on the reasons why these data points are so seductive for journalists and romance readers alike: I have opinions and theories, of course.
But for once, let’s just stick with the data.
And guess what?
The data does not exist.
The data does NOT exist to support the statement that romance is a billion dollar industry. Quite frankly, the data does not exist to make any sweeping statements about the size of the popular romance genre market.
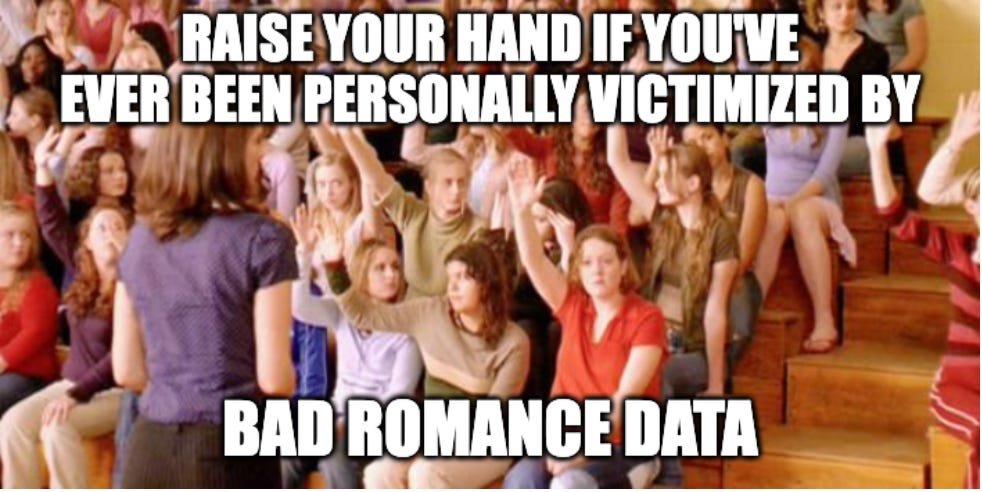
Personally victimized by bad romance data
Why do I care so much and why should you believe me on this, and not the multitude of other sources?
First, why do I care: what I feel personally invested in is separating the idea that romance has value from its perceived commercial value. “We” romance readers do not need romance to be a billion dollar industry for it to be a legitimate use of our leisure time, or for us to personally find it important and interesting.
Second, why should you believe me: because I’m a giant nerd who is (likely)1 the world’s foremost expert on the history of popular romance genre market data between 1972 and today.
I presented my research on “Bad Romance Data” at the 2023 International Association for the Study of Popular Romance conference. My research entailed spending a lot of time digging into the romance genre market data that exists and unpacking the methodologies to better understand what the data is actually telling us and what it can’t tell us.
At this point, I have a very good idea of the limitations of the existing data. While it’s hard to prove the lack of data, I also have a very good sense about what does not exist when it comes to publicly-available, credibly-sourced data.
After reviewing ~50 years of sources that publish, repeat, misrepresent, and overstate various claims, I can see that we’re stuck in a cycle. Nothing’s getting better, nothing’s really getting worse either. And yeah, there’s a whole other essay here about why journalism prioritizes trends and “surprising” information, but that’s not my beat.
What I can do is share what I’ve learned in my research and create at least counter narrative that addresses why the data does NOT support these common claims about the popular romance fiction genre.2
The conception of the “billion dollar industry”
I’m going to skip over some stuff that happened in the 1970s and 1980s and jump to the conception of the “billion dollar industry” data point.
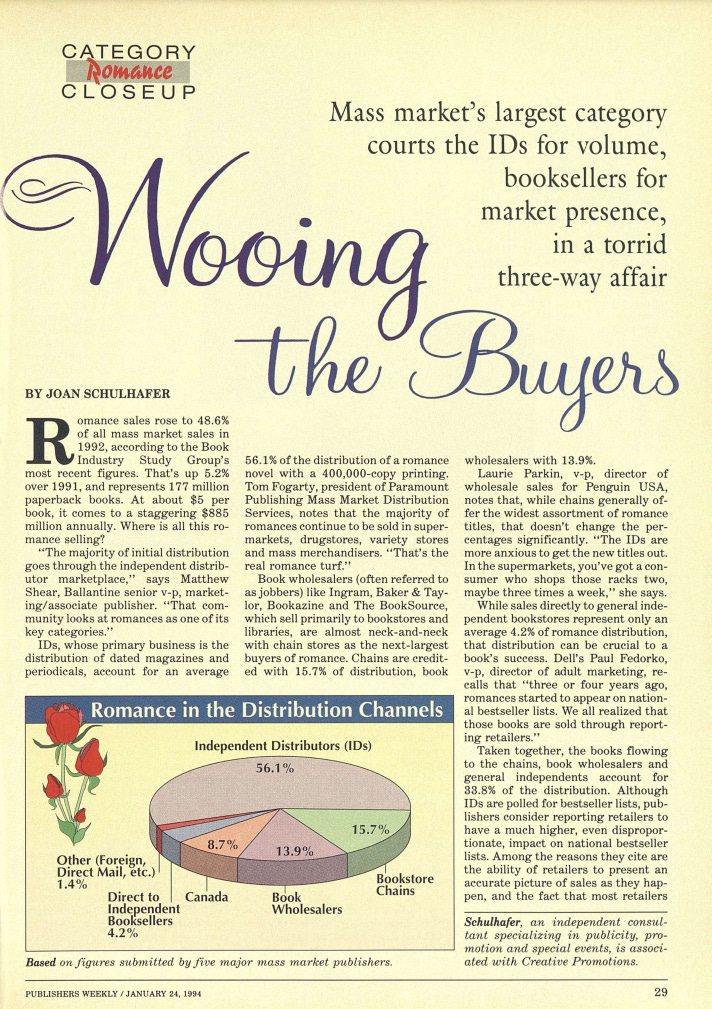
On January 24, 1994, Publishers Weekly published an article by Joan Schulhafer on romance and did a back of the envelope calculation that resulted in the number $885 million dollars in romance sales.
And it was a VERY back of the envelope calculation. Let’s break it down.
First let’s look at the source for the market data: the 1992 Book Industry Study Group (BISG) report. To oversimplify massively, BISG gathered data from major publishers that make up a proportion of the total industry and then extrapolates out growth patterns and total market size.3
Let’s take a closer look at the “data.”
Romance sales rose to 48.6% of all mass market sales in 1992, according to the Book Industry Study Group’s most recent figures. That’s up 5.2% over 1991, and represents 177 million paperback books. At about $5 per book, it comes to a staggering $885 million annually.4
Let’s just pretend that we can trust the data on the number of paperback romance books sold in 1992 enough to base everything else on.5
First problem: romance is sold in more formats than just mass market paperback, even in 1992. Ever heard of hardcover? Already this is not a complete estimate of the total size of the market.
Second problem: do you see how they’re estimating the size of the market? The author is literally just doing back of the napkin math: estimated number of books x estimated cost of a paperback book = size of market.
For the purposes of an article about distribution channels: SURE. FINE. WHATEVER. The whole point of even talking about it was to get to the final line: “Where is all this romance selling?”
Are you impressed? Because guess what: that’s the methodology for RWA’s first published data on the size of the romance market.
Why is everyone so obsessed with RWA’s ROMStat data?
We have to talk about RWA’s ROMStat Report because it is the primary source for almost every claim about the size of the romance novel market that you’ve heard about.
As you may know, RWA — the Romance Writer’s of America — was formed in 1980 with a mission “to advance the professional and common business interests of career-focused romance writers.” By 1984, in the midst of the contemporary category romance boom, they began an annual conference.
RWA noticed in 1994 when Publishers Weekly published their back of the napkin, market size math, and in 1995, they took out 4 full-page ads. Across 2 spreads, they claimed that romance had sales of $885 million a year according to Publishers Weekly. These ads were, naturally, in Publishers Weekly.
In 1997, Olivia “Libby” Hall is president of RWA and she’s profiled in the May 12, 1997 issue of Publishers Weekly, saying that the best thing RWA ever did was take out the ads “documenting how much of a market share romance commands.”
If you go to the Wayback machine for the RWA website in 1997, you’ll find the “$885 million” figure still prominently displayed in “The Romance Industry” section of their “Romance Genre Statistics” page.
By 1999, Libby Hall debuted the first official ROMStat report,6 detailing data from 1998.7 The ROMStat reports were published in RWA’s member publication, Romance Writer Report, ensuring that all of its members had ready access to the data.
RWA continued conducting their own research and publishing compiled reports until at least 2017, however the last update to the market size numbers was from 2013.
Through a combination of PDF versions of the ROMStat reports and web archive pages, I pieced together the various claims made by RWA through the years on the size of the romance market.
Here’s the most comprehensive look you’ll get at how RWA’s reports of romance market size changed over the years:
There are 2 main trend lines:
RWA “romance industry size” claims: plotted with colored dots for each published amount, with different colors representing the various sources RWA cited for the data over the years. This is important to help explain some of the abrupt shifts in numbers as RWA needed to reference sources with different methodologies.
U.S. GDP: The blue line is U.S. GDP, which I provided to give a sense of how the romance numbers tracked compared with growth and recessions in the greater economy. For example, the downward trend ~2010 in both romance and the GDP help us understand that the romance genre’s decline was more indicative of the economy than anything happening specifically with romance. Same with overall upward trends: as the GDP rises, industries rising at roughly the same rate are essentially keeping pace.
So what does this line graph of RWA’s ROMStat data prove?
How does the line graph above demonstrate my main point, that we don’t know the size of the popular romance fiction market and should question the “data” we’ve been given?
Before I go further: All of it is too old to be relevant in 2024
One thing I can’t stress enough is how old this data is. The latest report with refreshed market size data was from the year 2013. That’s 11 years ago. Even if the romance genre just kept pace with GDP, you’d see huge shifts in the number. Heck, even accounting for inflation, if the same number of books were sold in 2013 and 2024, the sales value would be hugely different.
OK, so did it used to be accurate?
Even looking at the data between 1992 and 2013 and considering how accurate they were at the time, I think seeing the data together starts to create a picture for why it was all smoke and mirrors to begin with, and the inherent flaws in trying to measure the size of the market, especially in the age of digital publishing and self publishing.
The market size fluctuations were never meaningful
Everyone wants to show an up-and-to-the-right chart. In 2002, RWA thought they had a steady and impressive upward trend — the industry was GROWING!
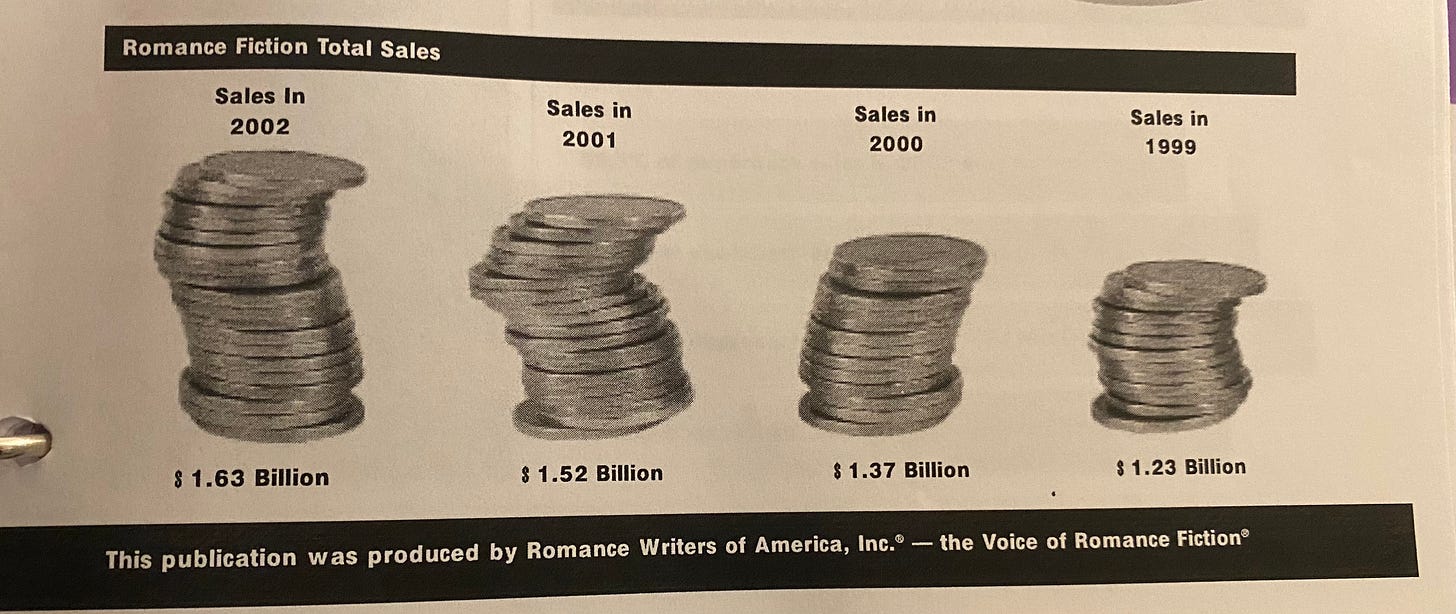
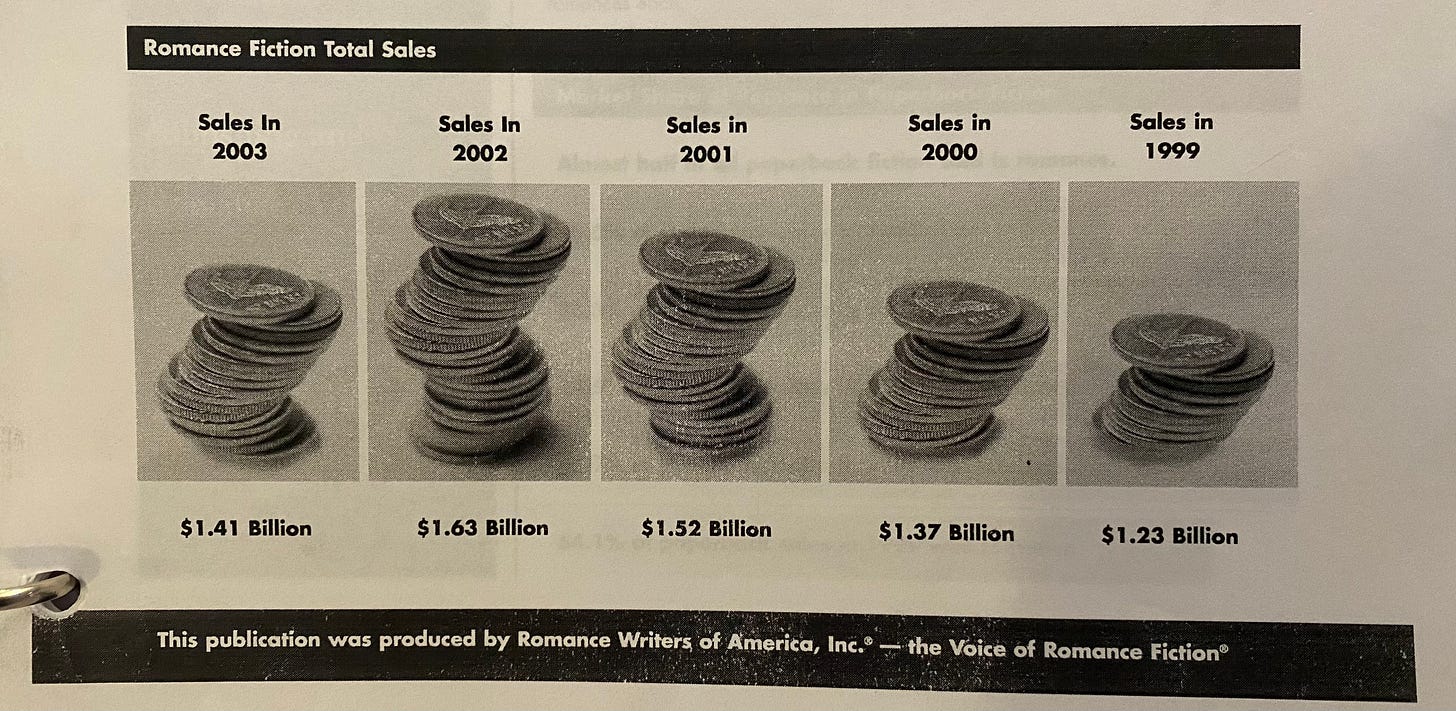
…But then the 2004 report rolls around, and now the 2003 numbers are down below the 2001 numbers.
In the 2005 report, the stopped visualizing this “data” alongside previous years. Is it a coincidence that decision coincided with 2004 “data” that was even lower, below even the 1999 levels?
Was the romance novel industry tanking in 2003 and 2004?
Probably not — it’s more likely a result of the changes in source of data and therefore method of measuring, which you can see from the colors in my chart.
Is it more likely that the romance genre lost $400 million in sales over a 2-year period, or that the method of measurement was unreliable and flawed?
Similarly, did the romance genre drop $400 million in the year between 2012 and 2013, or was the BookStats data just measured very differently? BookStats was a collaboration between BISG & the Association of American Publishers (AAP), ironically created to address discrepancies between their respective reporting and create more accurate, unified data.
Nobody can figure out how to aggregate digital and print sales
Just as RWA adopted BookStats data in 2013, BISG & AAP dissolved their collaboration. As far as I can remember from when I was deeper into this 6 months ago, the industry has yet to come together (at least for prolonged periods) on aggregate reports like BookStats since then.
You may have noticed the huge drop in the RWA data in 2013. I have a feeling this is because of both a report with new methodology as well as a major shift in formats with the rise of the eBook and audiobook. The RWA data, and lots of other reports, were built to measure print books and the methodologies didn’t support incorporating digital book sales.
2013 is also around the time that the historical dominance of traditional publishing in romance was being challenged. Which brings me to:
Amazon & self publishing
You know what data is not in any of these reports? Self-published romance. Unless the book sale is tracked by a large distributor (such as when indie authors work with Ingram to get print copies into bookstores), the only aggregator of the sales data is the distribution platform. The biggest of these is, of course, Amazon.
It’s essentially impossible to reach out to every indie author to individually collect their sales data the way BISG or AAP could go to 5 major publishers and collect normalized data that represented 30-70% of the market.
Traditional publishers can aggregate their sales data for authors across platforms, including print and digital on Amazon, so industry experts can probably get a sense of the size of the traditionally-published book market on Amazon. However, I guarantee Amazon will NEVER share any of the self-published ebook data.8
This is even before you consider how you’d measure the books purchased and read via the Kindle Unlimited subscription program, much less neatly segregate out just the romance.
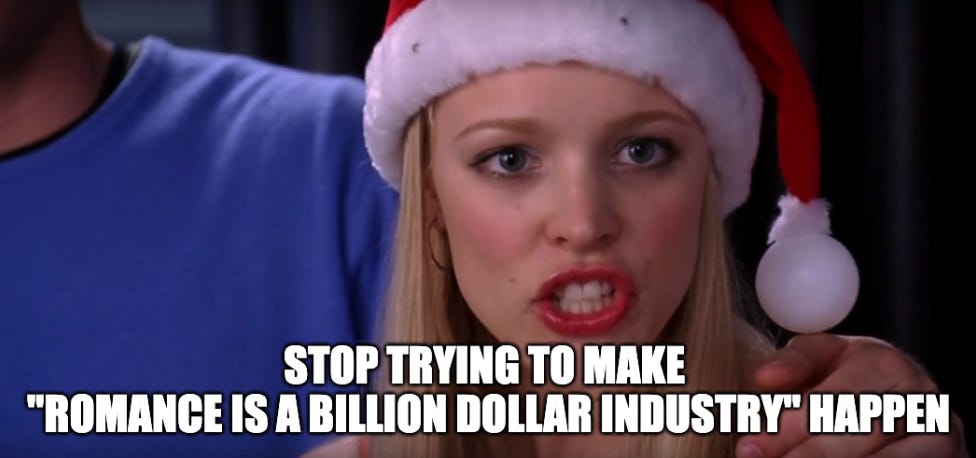
Stop trying to make “romance is a billion dollar industry” happen
There are reasons why it’s difficult if not impossible these days to quantify the size of the romance market, or even the overall book industry. I’ve barely even scratched the surface of why this is.
Fundamentally, what is the romance genre? How do you define the edges of it? Does Colleen Hoover write romance? Not according to the traditionally-accepted definition, yet most of her books are shelved as such. Colleen Hoover has had a huge couple of years, and it’s highly possible that any perceived blips of increased “romance” sales are directly a result of her popularity.
Realistically, what I and the average person would consider romance probably is a greater than billion dollar industry, especially in 2024. But then again, so are religion books, cookbooks, mystery novels, literary fiction, and children’s board books.
So what are we really saying when we trot out the figure? It isn’t enough to know that sales exceed a billion dollars — the utility of the data point for those who use it is in comparing it to something else, and to use it as a litmus test for the value of one thing compared to another.
The utility of having year over year data is to demonstrate the trend, yet I hope I’ve demonstrated that all of this “data” is at best anecdata, and that year over year trends are so flawed as to be meaningless.
So once again, I will repeat that it is my fervent hope that this Valentine’s Day, and every day, you join me in pushing back on the idea that we or the general public need this data to be a part of the conversation about romance novels.
We, all of us, do not need romance to be a billion dollar industry for it to be worthy of our consideration.
If someone would like to challenge me for dominance in this arena, I’d be delighted: please call me so we can be best friends and nerd out together.
I also plan to publish on this, but you know: that takes time.
I think it’s important to establish that no report ever in the history of book publishing reports EVER gathers all of the actual sales data from every source. While we can get a general sense of overall size of the industry, the margin of error is probably in the hundreds of millions.
Here’s a fun excerpt from a 2010 Publishers Weekly article where it’s acknowledged that BISG and AAP’s data has often conflicted, which calls into question the precision of methodologies prior to this point:
“The Association of American Publishers and the Book Industry Study Group are teaming up to develop new data-gathering models aimed at creating better statistics to measure sales for the entire book publishing industry as well as different market segments. For many years, the two organizations have developed their own statistics that tended to show different sales and growth rates. The new program will produce a unified, and hopefully, more accurate sales estimate.”
The number of questions I have about this one data point are truly endless. Did BISG’s sampling of publishers include Harlequin? If their sample was just the Big 5, at the time, that population would NOT include Harlequin. In 1994, Harlequin was owned by Torstar, and had yet to be acquired by NewsCorp, which eventually became part of HarperCollins.
The inclusion or exclusion of Harlequin in BISG’s sample would make a HUGE difference given the specialized nature of the publisher.
If Harlequin was or was not included, either way it would result in a non-representative % of romance in mass market paperbacks.
We can’t, but let’s pretend.
In 1997, the RWA National website states: “Since 1992, RWA has conducted an annual study of the romance market using various magazines, catalogs and information gathered from publishers. All major publishers were tracked, plus a few smaller ones.” As far as I can tell, the 1992-1998 data was not published as a “report” and was posted as updates to their website or other pre-internet press kit materials.
I’d need to do more digging to nail down the timeline of her roles — she was at one time Vice President, later President, and then I believe when she was no longer President continued compiling the RomStat report.
Hall was involved with tabulating the data on sales of romance fiction until the 2005 ROMStat report. Strangely, there are 2 versions for the 2005 report — the first was created by Hall, and the second thanks her for her service. The second also notes a big change in methodology given their previous source of sales data was no longer available.
Another wrinkle is how you’d narrow down which of the books are “romance,” which is basically an arbitrary distinction that becomes MUCH harder to define once you don’t have publishers somewhat consistently making those distinctions.





It is so helpful to look at this perspective. I am currently writing my dissertation on reading romance and relationships (specifically, using romance as an adjunct to sex and couples therapy), and it’s meaningful to me to hear that it doesn’t matter- legitimacy comes from its readers, not ages old statistics. Would love to connect with you some time to talk romance.
Fascinating! Love the Mean Girls memes. 🩷 We definitely don't need to justify reading romance with bad data.